In this tutorial, we will learn to print structural reports when we have finished our structural analysis in Orion 18.
For the sake of this tutorial, we will print the report for the columns on the first floor, though the same procedure is applicable for other types of structural reports like frames, beams, etc.
Step 1
Click ‘Run’, then ‘Building Analysis’ from the menu bar at the top of the screen. Click ‘Post-Analysis’, then ‘Analysis Results Report’.
Step 2
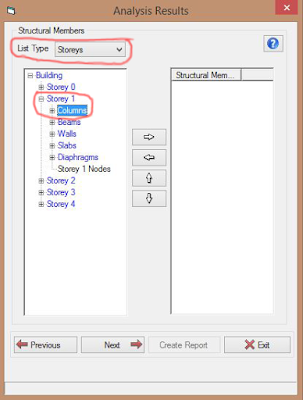
In the ‘Analysis Results’ dialog box that appears, Select ‘Storeys’ from the ‘List type’ dropdown. Choose ‘Storey 1’. Click the ‘+’ sign next to ‘Storey 1’ and select ‘Columns’.
Step 3
Step 4
Click ‘Next’, then select the results you want shown in the report (For this tutorial, N-i, M1-i, M2-i) and select the load combination (‘K1-G+Q*F’) for the report to be printed.
NB: Those options on the right column with ‘Y’ are individual load cases while those with ‘K’ are load combinations.
N-i, M1-i, M2-i represent the column axial load, moment in ‘Dir-1 Axis’ and moment in ‘Dir-2 Axis’ respectively for the top of the column
These diagrams below, created by CSC (now owned by Tekla), will help illustrate the forces referred to by the terminologies on the left column of the diagram above.
The terminologies on the diagram are as follows:
N: Axial load
V2: Shear force in the direction ‘2’ from the diagram above. (Equivalent to V1 in the second ‘Analysis Results’ pictured above)
V3: Shear force in the direction ‘3’ from the diagram above. (Equivalent to V2 in the second ‘Analysis Results’ pictured above)
T: Torsion
M2: Moment in the direction ‘2’ from the diagram above. (Equivalent to M1 in the second ‘Analysis Results’ pictured above)
M3: Moment in the direction ‘3’ from the diagram above. (Equivalent to M2 in the second ‘Analysis Results’ pictured above)
‘i’ and ‘j’ represent the start and end joints as indicated in the diagrams above.
Step 5
After selecting the internal forces and load cases to be reported, Click ‘Next’ again. Select ‘Sort by Loading’ and tick the box for ‘Skip Line between Elements’. These are editing options for arranging the structural reports.
Step 6
Click ‘Create Report’ for the structural report to be printed in a WordPad.
You can also try the same procedure for other structural elements as well as frames that make up the building.
For comments and questions, you can reach us through the contact form below. You can also subscribe to receive our weekly newsletters so that you never miss a thing.
ORION 18: HOW TO CREATE ANALYSIS REPORT
 Reviewed by Izuchukwu Obi
on
00:10:00
Rating:
 Reviewed by Izuchukwu Obi
on
00:10:00
Rating:


No comments: